Bangladesh: Land, People and History · Chapter 12 of 16
The Economy of Bengal and Bangladesh: Two Thousand Years in Numbers
Bengal's wealth before 1757 was real, and it can be measured in trade and revenue rather than in GDP: around 1700 Bengal supplied 55 per cent by value of the Asian textiles the Dutch company imported into Holland and 42 per cent of the English company's Asian exports, and its assessed land revenue rose from about Rs 1.07 crore in 1595-96 to about Rs 1.41 crore in 1720.1 No GDP series exists for Bengal alone before 1950, and the popular claim that Bengal produced 12 per cent of world GDP is footnoted to a 2015 paper that contains no such figure; Maddison's estimates for undivided India as a whole put it at about a quarter of world output in 1700.2 Since independence, Bangladesh's GDP has grown from US$6.29 billion in FY1971-72 to US$456.3 billion in FY2024-25 (current dollars), and the country is due to leave the UN's least developed country category on 24 November 2029.3
- 55%
- Bengal's share, by value, of the Asian textiles imported into Holland by the Dutch company at the turn of the eighteenth century4
- 88%
- Bengal raw silk's average share of all Asian raw silk sold in Amsterdam, 1693 to 17205
- 1 crore
- Rupees a year sent regularly from Bengal to the Mughal emperor from 1702, under Murshid Quli Khan6
- 1950
- First year for which the Maddison Project gives any figures for the territory of Bangladesh; there is no Bengal-only GDP series before it7
- US$456.3 bn
- Bangladesh's GDP in FY2024-25, current US dollars, up from US$6.29 billion in FY1971-728
- 24 Nov 2029
- Scheduled date of Bangladesh's graduation from the least developed country category9
Sources: Om Prakash (2004); Banglapedia; Maddison Project Database 2023; World Bank, World Development Indicators; UN General Assembly resolution 81/8.10
A Dutch lodge on the Hooghly
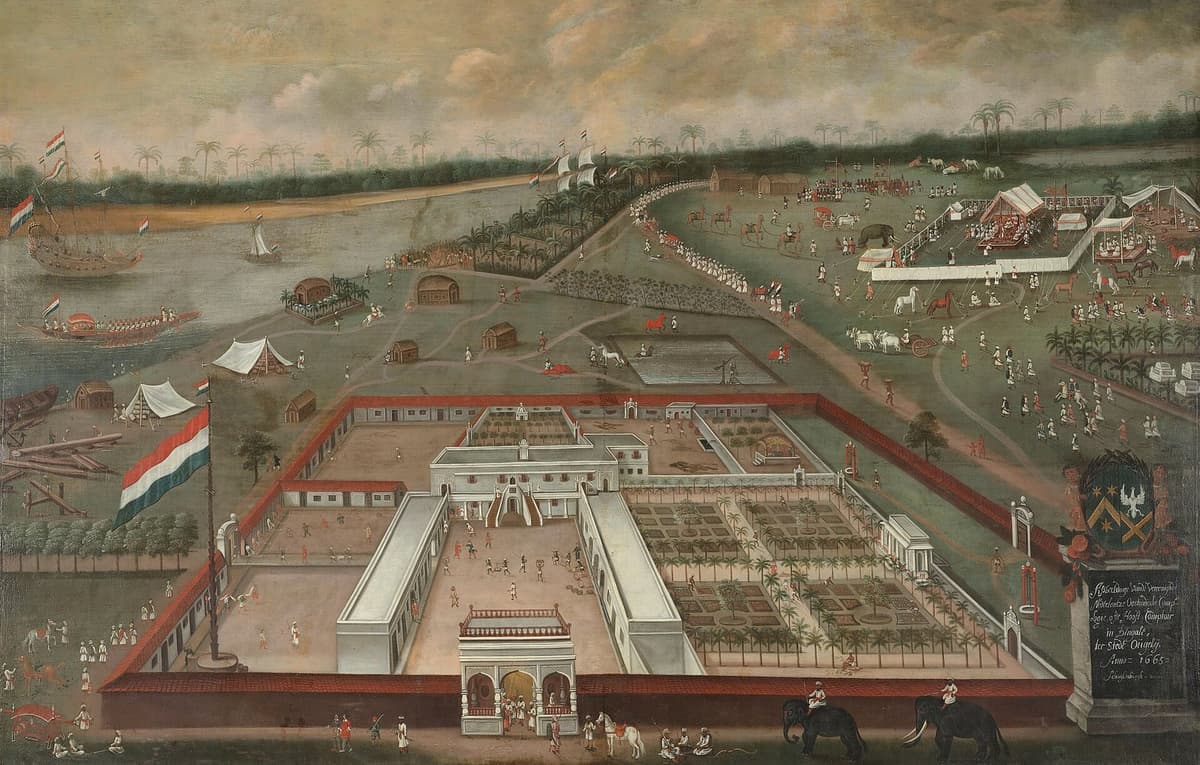
In 1665 the painter Hendrik van Schuylenburgh painted the Dutch East India Company's lodge at Hooghly in Bengal: a walled compound under a Dutch flag, ships on the river, and a long procession heading towards the camp of an Indian dignitary. It is a picture of a buying station. In 1619-21 pepper and spices had made up 74 per cent of the company's exports from Asia; by 1698-1700 that share had fallen to 23 per cent, while textiles and raw silk had risen from 16 per cent to 55 per cent.12 Much of that cloth and silk came from Bengal. At the turn of the eighteenth century, "value-wise as much as 55 percent of the total of Asian textiles imported into Holland had originated in Bengal alone", and between 1693 and 1720 Bengal raw silk made up, on average, 88 per cent of the Asian raw silk sold in Amsterdam.13
This chapter makes a simple argument. Bengal's wealth before 1757 was real, and it can be measured: in the ledgers of the European companies, in the revenue rolls of the Mughal treasury and in the silver rupees the province sent to the emperor. The number most often quoted for it, that Bengal produced 12 per cent of the world's GDP, is not one of those measurements. The paper it is footnoted to on Wikipedia contains no such figure.14 The evidence suggests that the true story is both more modest and more interesting than the slogan.
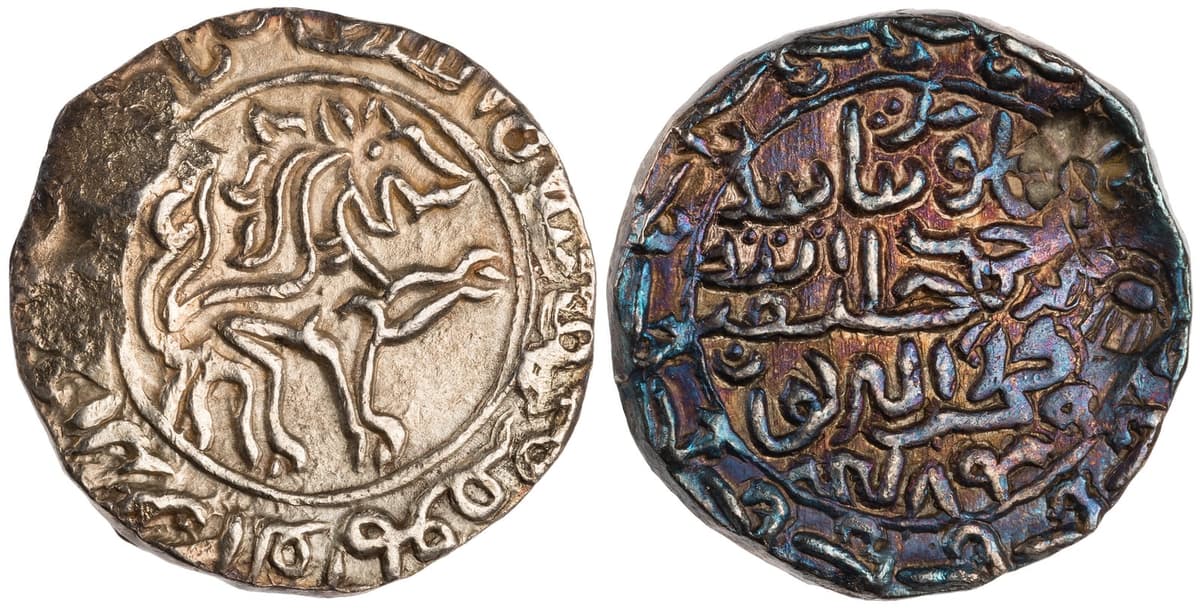
Start with what cannot be measured. No GDP series exists for Bengal on its own before 1950. The Maddison Project Database, the standard long-run dataset, gives figures for the territory of Bangladesh only from 1950; for earlier years it gives figures for "India", meaning the whole subcontinent.15 Its India population falls from 415.2 million in 1946 to 346.0 million in 1947, which shows the change of territory at Partition.16 Stephen Broadberry, Johann Custodis and Bishnupriya Gupta, whose work supplies the database's Indian figures for 1600 to 1870, say plainly that their estimates "are for the territory of the Indian sub-continent, including Pakistan and Bangladesh as well as modern India, for the whole period 1600-1871".17 Every GDP figure before 1947 in this chapter is therefore a figure for undivided India, not for Bengal.
For Bengal itself historians have three other kinds of evidence: the trade records of the Dutch and English companies, studied above all by Om Prakash and Sushil Chaudhury; the Mughal revenue assessments, from the Ain-i-Akbari of about 1595 to James Grant's analysis of 1786; and scattered wage and price data.18 Read together, they support a hedged version of the old boast. The historian C. A. Bayly wrote that Bengal "had probably been the wealthiest province of Mughal India".19 Tirthankar Roy dates an economic boom to Bengal's incorporation into the Mughal empire around 1590, and writes that "Records of European voyages in Bengal confirm the picture of prosperity."20
Bengal in the company ledgers
By about 1700 Bengal was the English company's largest source of Asian goods and supplied around two-fifths of the Dutch company's. For the English East India Company, Om Prakash writes, "Bengal was by far the largest area of operation accounting for 42 percent of the total Asian exports in 1698-1700 and 54 percent in 1777-79."21 For the Dutch, the Banglapedia entry by Aniruddha Ray and Sushil Chaudhury puts Bengal's share of the average annual value of Asian goods shipped to Holland at around 40 per cent in the early eighteenth century, with Bengal cloth making up more than half the value of the company's Asian textile exports.22
Show the numbers
| Year | Bengal's share |
|---|---|
| VOC textiles | 55 |
| VOC raw silk | 88 |
| EIC 1698-1700 | 42 |
| EIC 1777-79 | 54 |
Source: Om Prakash (2004), exact figures. VOC textiles: share by value of Asian textiles imported into Holland, turn of the eighteenth century. VOC raw silk: share of Asian raw silk sold in Amsterdam, average of 1693 to 1720. EIC: share of the English company's total Asian exports in the years shown. Each bar is a different measure.23 Download CSV
The growth was steep. The historian Om Prakash, as summarised in a Gale encyclopedia, estimates that Dutch exports from Bengal rose from 100,000 rupees in the 1640s to 3 million in 1720.24 Banglapedia, computing from Prakash's book, gives average annual VOC exports from Bengal to Europe of 2,315,384 guilders in 1701-10 and 2,650,607 guilders in 1710-20.25 In 1730-55 the English company's exports from Bengal averaged about £440,000 a year, a little over Rs 3.5 million; the Dutch exported about £284,775 a year to Europe in the first five years of the 1750s.26 English factors called Bengal "the flower in the Company's garden" and the "choicest jewel".27
The European ledgers are only part of the picture, and this matters for the argument. Sushil Chaudhury has argued that Asian merchants, not Europeans, dominated Bengal's export trade before Plassey.28 In the mid-eighteenth century, on the figures in Banglapedia, Asian merchants exported Bengal textiles worth about Rs 9 to 10 million a year, against at most Rs 5 to 6 million by the Europeans, and in silk "the Asian share of the silk export from Bengal was 4 to 5 times more than the European share".29 On these figures most of Bengal's cloth and silk exports were in Asian hands, so the famous company shares measure only part of the province's trade. For the cloth itself, see the chapter on Dhaka muslin.
What Bengal paid the emperor
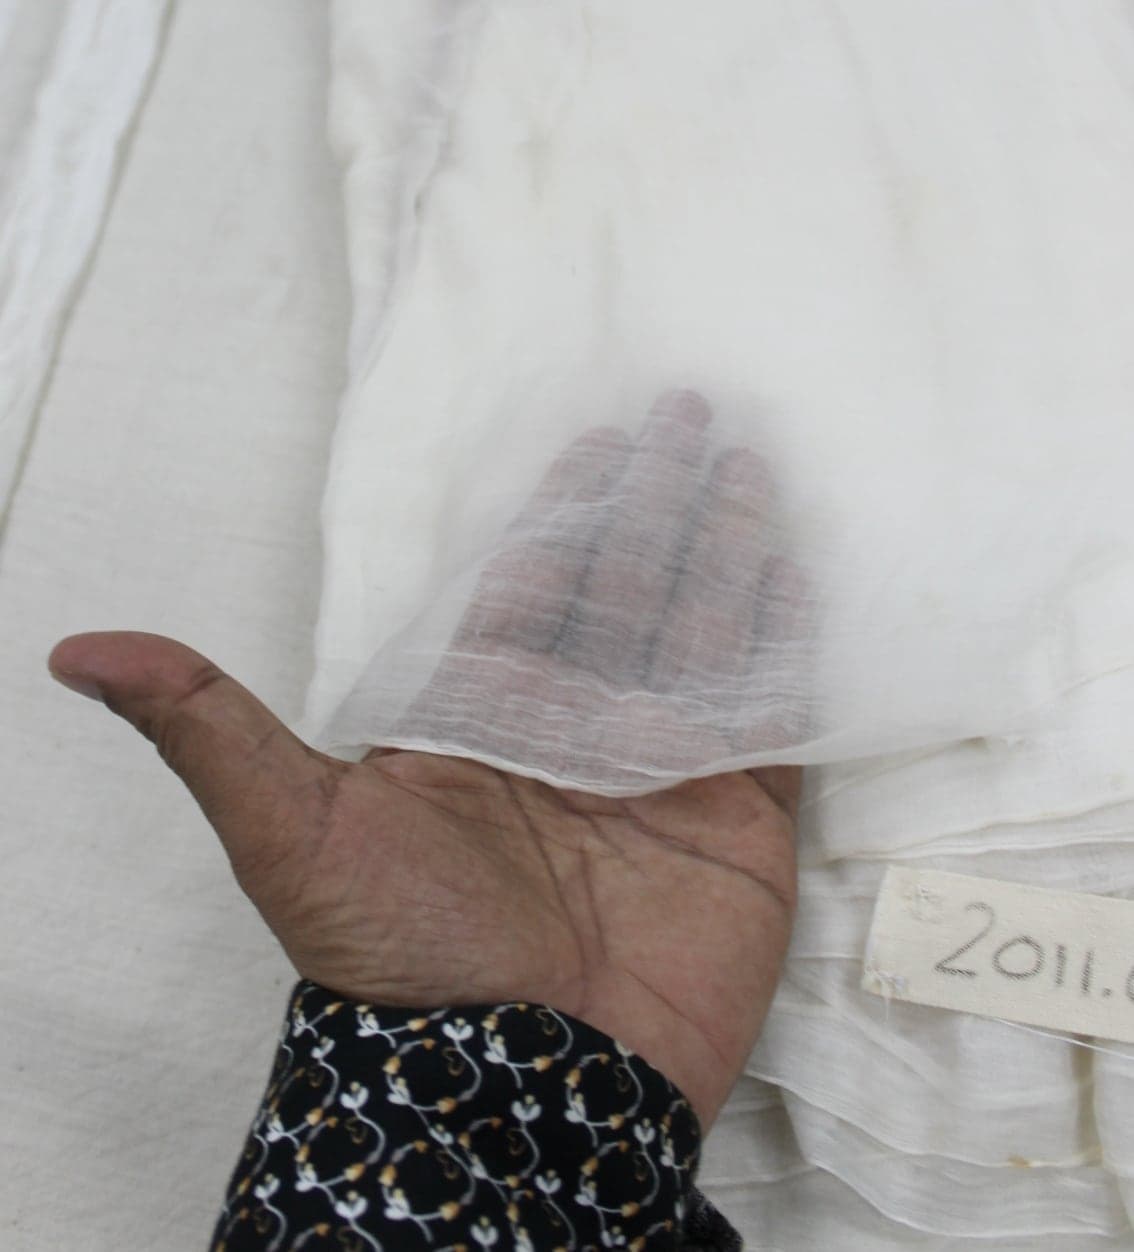
The second measure of Bengal's wealth is what the Mughal state expected it to pay. Around 1595 the Ain-i-Akbari, written by Abu'l Fazl, court historian of the emperor Akbar, recorded that the Subah of Bengal consisted of 24 sarkars and 787 mahals, with a revenue of 59,84,59,319 dams, which it gave as Rs 1,49,61,482.31 That total included the Orissa sarkars.32 Grant converted at 40 dams to the rupee, and Broadberry, Custodis and Gupta, following Habib, use the same rate.33
The historian Irfan Habib compiled the jama, the assessed revenue, of Bengal from the Mughal records. His series begins, for Bengal without Orissa, at 42,77,26,681 dams in 1595-96, about Rs 1.07 crore, and ends at 56,46,14,760 dams in 1720, about Rs 1.41 crore.34 Habib himself stressed how slowly it rose in the seventeenth century: "The total jama'dami of Bengal only rose from 42,77,26,681 in the Ain to 52,46,36,240 in the later years of Aurangzeb."35
Show the numbers
| Year | Assessed revenue |
|---|---|
| 1595-96 | 10.69 |
| 1628-36 | 10.06 |
| 1646-47 | 11.18 |
| c. 1656 | 11.45 |
| c. 1667 | 13.09 |
| 1687-c. 1709 | 13.12 |
| 1720 | 14.12 |
Source: Irfan Habib, The Agrarian System of Mughal India (1963), Appendix D, which gives the figures in dams; converted here at 40 dams to the rupee. The 1595-96 figure excludes Orissa. These are assessments, not collections, read from a scanned copy of the book, and the periods are of unequal length.36 Download CSV
James Grant, whose analysis of Bengal's finances was written in 1786 and printed in the House of Commons' Fifth Report of 1812, gives three landmarks in rupees. Todar Mal's original rent roll for Bengal proper came to Rs 1,06,93,152; Shah Shuja, governor of Bengal from 1639 to 1660, raised it in 1658 to Rs 1,31,15,907; and Murshid Quli Khan's complete rent roll of 1722 came to Rs 1,42,88,186, spread over 13 chaklas and 1,660 parganas.37 Grant and Habib give almost the same figure for Todar Mal's roll, 42,77,26,082 dams against 42,77,26,681.38
| Date | Assessed revenue | Coverage | Source |
|---|---|---|---|
| c. 1595 | 59,84,59,319 dams (given as Rs 1,49,61,482) | Bengal with the Orissa sarkars; 24 sarkars, 787 mahals | Ain-i-Akbari39 |
| 1595-96 | 42,77,26,681 dams (about Rs 1.07 crore) | Bengal only | Habib40 |
| 1658 | Rs 1,31,15,907 | Bengal (Shah Shuja's roll) | Grant41 |
| 1687 to c. 1709 | 52,46,36,240 dams (about Rs 1.31 crore) | Bengal | Habib42 |
| 1720 | 56,46,14,760 dams (about Rs 1.41 crore) | Bengal | Habib43 |
| 1722 | Rs 1,42,88,186 | 13 chaklas, 1,660 parganas (Murshid Quli Khan's roll) | Grant44 |
Source: Abu'l Fazl, Ain-i-Akbari, trans. Jarrett; Habib (1963), Appendix D; Grant (1786). Rupee equivalents for Habib's figures are dams divided by 40. Habib's and Grant's figures were read from scanned copies and differ slightly for Todar Mal's roll, so both are given.45
The money did not stay in Bengal. Murshid Quli Khan became the province's diwan (chief revenue officer) in 1701, and under his management "the regular flow of one kror of rupees every year from Bengal" to the emperor began in 1702.46 He was formally appointed subahdar in 1717, moved the capital from Dhaka to Murshidabad the same year, made a fresh revenue settlement in 1722 that improved on those of Todar Mal and Shah Shuja, and died on 30 June 1727.47 Writing of the British conquest, Bayly refers to "The massive Rs 30 million land revenues" of a province that "proved an extraordinary prize for the British".48 The story of that prize is told in the chapters on Mughal Bengal and colonial Bengal.
A caution belongs here. Revenue figures show what Bengal was assessed to pay, and Banglapedia calls it "the richest province of the Empire".49 But a high assessment on its own does not prove that Bengal was richer per head than every other province, and the comparison with the other Mughal provinces has not been made for this guide. That is why Bayly's "probably" is the right word.50
India and Britain over three centuries
Broadberry, Custodis and Gupta's estimates show undivided India's income per head falling steadily behind Britain's from 1600 onwards, most sharply between 1650 and 1700. Broadberry, Custodis and Gupta built the first output-based GDP series for India before 1871, adding up agriculture, industry and services and dividing by population.51 Their verdict: "Indian per capita GDP declined steadily during the seventeenth and eighteenth centuries before stabilising during the nineteenth century."52 And in comparison with Britain: "Whereas in 1600, Indian per capita GDP was over 60 per cent of the British level, by 1871 it had fallen to less than 15 per cent."53
Show the numbers
| Year | India as % of Great Britain |
|---|---|
| 1600 | 61.5 |
| 1650 | 58.8 |
| 1700 | 40.3 |
| 1750 | 34.2 |
| 1801 | 27.7 |
| 1811 | 25.5 |
| 1821 | 24.7 |
| 1831 | 22 |
| 1841 | 21.5 |
| 1851 | 18.8 |
| 1861 | 16.2 |
| 1871 | 14.5 |
Source: Broadberry, Custodis and Gupta (2015), table 13. India means the territory of the whole subcontinent, including today's Pakistan and Bangladesh.54
The Maddison Project's 2023 update uses their Indian series for 1600 to 1870 and sets it beside a British series from Broadberry and colleagues' British Economic Growth.55 On those figures, measured in 2011 international dollars, India's GDP per capita fell from 1,264 in 1600 to 850 in 1870, while the United Kingdom's rose from 1,691 to 5,829.56 Calculated from those figures, India stood at 74.7 per cent of the British level in 1600, 48.2 per cent in 1700 and 14.6 per cent in 1870.57 The two sources give different ratios for 1600, 74.7 per cent against 61.5 per cent, and they compare India with different units: Great Britain in Broadberry, Custodis and Gupta's table, and England alone in the database's "UK" series before 1700.58
Show the numbers
| Year | United Kingdom (England before 1700) | India (undivided) |
|---|---|---|
| 1600 | 1,691 | 1,264 |
| 1650 | 1,446 | 1,189 |
| 1700 | 2,412 | 1,162 |
| 1750 | 2,702 | 1,068 |
| 1801 | 3,351 | 1,033 |
| 1821 | 3,308 | 937 |
| 1850 | 4,332 | 947 |
| 1870 | 5,829 | 850 |
Source: Maddison Project Database 2023 (Bolt and van Zanden), whose figures for India come from Broadberry, Custodis and Gupta (2015) and for the United Kingdom from Broadberry, Campbell, Klein, Overton and van Leeuwen (2015). The UK series before 1700 covers England only. The years are not evenly spaced.59 Download CSV
The new series overturned an older view. Angus Maddison's 2010 figures, Broadberry and his co-authors write, "suggest that India was always very poor, with a per capita GDP of just $550 in 1990 prices in the year 1500"; their own data "suggest a substantially higher GDP per capita in 1600, of the order of $700", consistent with "a prosperous India at the height of the Mughal Empire during the time of Akbar", though "much of this prosperity had disappeared by the eighteenth century".60 They put a "bare bones subsistence level" at about $400 in 1990 dollars, and conclude that it was "only by the beginning of the nineteenth century that most Indians were reduced to" it.61
Silver makes the comparison look very different from grain. For about 1600 the same authors estimate Mughal GDP at Rs 559.68 million for 85.2 million people, or Rs 6.57 a head, against £5.66 in England.62 Converted at the silver exchange rate of Rs 8 to the pound, India's level was 14.5 per cent of England's; converted at what the money would buy in wheat, it was 71.2 per cent.63 Indian money bought a great deal of food, and much of the argument over Indian living standards turns on that gap.
For Bengal on its own, the one direct estimate is Tirthankar Roy's. He concluded that "(a) average income in Bengal was significantly smaller than that in contemporary Western Europe, and (b) there is insufficient basis to infer either growth or decline in average income in the eighteenth century."64 Broadberry and his co-authors say their results are "broadly consistent with Roy's (2010) point estimates of GDP per capita in Bengal and Britain around 1800".65
Wages: cheap in silver, rich in grain
Wage evidence points the same way. Broadberry and Gupta compared what an unskilled labourer earned in a day in India and in southern England, both in grams of silver and in kilograms of grain.66 In silver, Indian wages were never more than 27 per cent of the English level and fell to 12 per cent in 1800-49; in grain, they were 80 to 95 per cent of the English level until 1700, then fell to 40 per cent in 1700-49 and 29 per cent in 1800-49.67
| Period | England, silver (g/day) | India, silver (g/day) | India as % of England | England, grain (kg/day) | India, grain (kg/day) | India as % of England |
|---|---|---|---|---|---|---|
| 1550-99 | 3.4 | 0.7 | 21 | 6.3 | 5.2 | 83 |
| 1600-49 | 4.1 | 1.1 | 27 | 4.0 | 3.8 | 95 |
| 1650-99 | 5.6 | 1.4 | 25 | 5.4 | 4.3 | 80 |
| 1700-49 | 7.0 | 1.5 | 21 | 8.0 | 3.2 | 40 |
| 1750-99 | 8.3 | 1.2 | 14 | 7.0 | 2.3 | 33 |
| 1800-49 | 14.6 | 1.8 | 12 | 8.6 | 2.5 | 29 |
Source: Broadberry and Gupta (2006), table 6. Grain wages in kilograms of wheat; rice converted to wheat equivalent for 1700-99.68
None of these wages comes from Bengal: the Indian data are from Agra, Surat and south India.69 On Bengal the authors add only that Mukerjee's eighteenth-century figures "are also consistent with high grain wages despite low silver wages, because of the cheap price of rice".70 A newer dataset by Pim de Zwart and Jan Lucassen runs "from Gujarat in the west to Bengal in the east" for the 1590s to the 1870s; they argue that northern India's divergence from England began in the late seventeenth century and widened after the 1720s, and especially after the 1800s.71
Did Bengal produce 12 per cent of world GDP?
No scholarly source for the claim has been found. On Wikipedia's page on the deindustrialisation of India it appears beside a second figure, that Bengal generated 50 per cent of Mughal GDP, and both are footnoted to the 2015 paper by Broadberry, Custodis and Gupta. That paper contains no estimate of Bengal's share of Indian or world GDP, and no world-GDP shares of any kind.75 The research for this guide found no scholarly study that estimates Bengal at half of Mughal output.
What does exist is Maddison's estimate for India as a whole. In his 2010 dataset, undivided India produced 32.0 per cent of world GDP in the year 1 CE, 24.4 per cent in 1500, 22.4 per cent in 1600 and 24.5 per cent in 1700, falling to 16.1 per cent in 1820, 12.2 per cent in 1870 and 7.5 per cent in 1913.76 Britain's share rose from 1.8 per cent in 1600 to 9.0 per cent in 1870.77
Show the numbers
| Year | India | United Kingdom |
|---|---|---|
| 1 CE | 32 | 0.3 |
| 1000 | 27.8 | 0.7 |
| 1500 | 24.4 | 1.1 |
| 1600 | 22.4 | 1.8 |
| 1700 | 24.5 | 2.9 |
| 1820 | 16.1 | 5.2 |
| 1870 | 12.2 | 9 |
| 1913 | 7.5 | 8.2 |
| 1950 | 4.2 | 6.5 |
Source: Angus Maddison, "Statistics on World Population, GDP and Per Capita GDP, 1-2008 AD" (2010), sheet "GDP"; shares calculated from his GDP totals for India, the United Kingdom and the world. The years are not evenly spaced, and the early figures are conjectures; the 2023 update of the database gives no Indian GDP per capita before 1600.78 Download CSV
Those numbers need care. They are Maddison's conjectures, not measurements, and the 2023 Maddison Project update gives no GDP per capita for India for the years 1, 1000 or 1500, only population.79 They are also in 1990 dollars, a different unit from the 2011 dollars of the newer series, so the two should never be put on one chart.80 And India's large share reflects its very large population: 165 million people in 1700 on the database's figures, against 8.6 million in the United Kingdom.81
When the looms lost their markets
India's textile exports to Britain peaked around 1800 and then collapsed within a generation. On figures compiled by Broadberry, Custodis and Gupta from the work of K. N. Chaudhuri and of Bowen, India sent 291,666 pieces of cloth to Britain in 1665, 868,095 in 1700 and 1,037,440 in 1801; by 1831 the figure was 287,814.87 At the same time British machine-made cloth poured in, from 1 million yards in 1811 to 141 million in 1841 and 793 million in 1871.88 An index of India's export industries (1871 = 100) stood at 148.6 in 1600, peaked at 457.9 in 1801, then fell to 65.2 in 1831 and 49.5 in 1851.89
| Year | Textile exports to Britain (pieces) | Cloth imports from Britain (million yards) | Home production for the home market (million yards) |
|---|---|---|---|
| 1665 | 291,666 | ||
| 1700 | 868,095 | 0 | 970 |
| 1750 | 701,485 | 0 | 1,098 |
| 1801 | 1,037,440 | 0 | 1,178 |
| 1811 | 691,640 | 1 | 1,075 |
| 1821 | 758,397 | 20 | 1,026 |
| 1831 | 287,814 | 38 | 1,101 |
| 1841 | 141 | 1,266 | |
| 1851 | 348 | 1,374 | |
| 1861 | 514 | 1,475 | |
| 1871 | 793 | 1,306 |
Source: Broadberry, Custodis and Gupta (2015), tables 5B and 6, from Chaudhuri (1978) for 1665 to 1761 and Bowen (2007) for 1761 to 1834. Blank cells: no figure in the source.90
The home market tells a gentler story than the export market. Domestic production for Indian buyers fell from 1,178 million yards in 1801 to 1,026 million in 1821, then recovered to 1,475 million in 1861.91 The authors find "an absolute fall in Indian industrial production during the first three decades of the nineteenth century", but "the scale of the fall was less than suggested by some nationalist authors (Bagchi, 1976)".92 They add that the fall was probably steeper in Bihar than in India as a whole "on account of the high concentration of employment in cotton textiles in the Bengal region".93
Why did it happen? David Clingingsmith and Jeffrey Williamson date India's deindustrialisation as greatest between about 1750 and 1860. India "was a major player in the world export market for textiles in the early 18th century" but lost its export market and much of its home market, mainly to Britain; they find that local supply-side forces, political fragmentation and rising drought, mattered as early as 1700, alongside the world price shocks of British industrial ascent.94 On this reading, a Dhaka weaver who lost his European buyers after 1800 lost them to British machines, but the ground had been shifting under him for a century. The fate of the Dhaka muslin trade is followed in detail in the muslin chapter.
From 1971: a poor start and fifty years of growth
In the first years of independence Bangladesh was poorer than at any other point in the Maddison series. The database puts the territory's GDP per capita at 861 (2011 dollars) in 1950, 1,004 in 1970, 934 in 1971, 807 in 1972 and 792 in 1973, the lowest figure between 1950 and 2022.95 World Bank figures show real GDP falling by 5.48 per cent in FY1970-71 and by 13.97 per cent in FY1971-72, the years of the war and its aftermath.96 The background is told in the chapters on East Pakistan and the Liberation War.
From that low base real GDP grew in every year from FY1975-76 onwards.97 In current US dollars GDP rose from US$6.29 billion in FY1971-72 to US$31.6 billion in FY1989-90, US$115.3 billion in FY2009-10 and US$456.3 billion in FY2024-25.98 GDP per head rose from US$88 to US$2,597 over the same span.99 The World Bank reports Bangladesh's national accounts on a fiscal year ending on 30 June, and shows each year under its second calendar year, so its "2025" is FY2024-25.100
Show the numbers
| Year | GDP |
|---|---|
| FY1971-72 | 6.29 |
| FY1972-73 | 8.09 |
| FY1973-74 | 12.51 |
| FY1974-75 | 19.45 |
| FY1975-76 | 10.12 |
| FY1976-77 | 9.65 |
| FY1977-78 | 13.28 |
| FY1978-79 | 15.57 |
| FY1979-80 | 18.14 |
| FY1980-81 | 20.25 |
| FY1981-82 | 18.53 |
| FY1982-83 | 17.61 |
| FY1983-84 | 18.92 |
| FY1984-85 | 22.28 |
| FY1985-86 | 21.77 |
| FY1986-87 | 24.3 |
| FY1987-88 | 26.58 |
| FY1988-89 | 28.78 |
| FY1989-90 | 31.6 |
| FY1990-91 | 30.96 |
| FY1991-92 | 31.71 |
| FY1992-93 | 33.17 |
| FY1993-94 | 33.77 |
| FY1994-95 | 37.94 |
| FY1995-96 | 46.44 |
| FY1996-97 | 48.24 |
| FY1997-98 | 49.98 |
| FY1998-99 | 51.27 |
| FY1999-00 | 53.37 |
| FY2000-01 | 53.99 |
| FY2001-02 | 54.72 |
| FY2002-03 | 60.16 |
| FY2003-04 | 65.11 |
| FY2004-05 | 69.48 |
| FY2005-06 | 71.8 |
| FY2006-07 | 79.61 |
| FY2007-08 | 91.64 |
| FY2008-09 | 102.48 |
| FY2009-10 | 115.28 |
| FY2010-11 | 128.61 |
| FY2011-12 | 133.31 |
| FY2012-13 | 150 |
| FY2013-14 | 172.89 |
| FY2014-15 | 195.15 |
| FY2015-16 | 265.22 |
| FY2016-17 | 293.73 |
| FY2017-18 | 321.36 |
| FY2018-19 | 351.23 |
| FY2019-20 | 373.98 |
| FY2020-21 | 416.27 |
| FY2021-22 | 460.13 |
| FY2022-23 | 437.42 |
| FY2023-24 | 450.12 |
| FY2024-25 | 456.32 |
Source: World Bank, World Development Indicators, series NY.GDP.MKTP.CD (downloaded 22 November 2026). The jump between FY2014-15 and FY2015-16 is a break in the series, not a year of growth: see "How to read these numbers" below.101 Download CSV
Show the numbers
| Year | GDP per capita |
|---|---|
| FY1971-72 | 88 |
| FY1972-73 | 110 |
| FY1973-74 | 165 |
| FY1974-75 | 250 |
| FY1975-76 | 127 |
| FY1976-77 | 118 |
| FY1977-78 | 158 |
| FY1978-79 | 181 |
| FY1979-80 | 206 |
| FY1980-81 | 224 |
| FY1981-82 | 200 |
| FY1982-83 | 185 |
| FY1983-84 | 193 |
| FY1984-85 | 222 |
| FY1985-86 | 212 |
| FY1986-87 | 231 |
| FY1987-88 | 248 |
| FY1988-89 | 263 |
| FY1989-90 | 283 |
| FY1990-91 | 272 |
| FY1991-92 | 273 |
| FY1992-93 | 281 |
| FY1993-94 | 281 |
| FY1994-95 | 309 |
| FY1995-96 | 372 |
| FY1996-97 | 379 |
| FY1997-98 | 386 |
| FY1998-99 | 388 |
| FY1999-00 | 397 |
| FY2000-01 | 395 |
| FY2001-02 | 394 |
| FY2002-03 | 427 |
| FY2003-04 | 456 |
| FY2004-05 | 480 |
| FY2005-06 | 490 |
| FY2006-07 | 538 |
| FY2007-08 | 613 |
| FY2008-09 | 679 |
| FY2009-10 | 757 |
| FY2010-11 | 837 |
| FY2011-12 | 860 |
| FY2012-13 | 958 |
| FY2013-14 | 1,094 |
| FY2014-15 | 1,224 |
| FY2015-16 | 1,649 |
| FY2016-17 | 1,811 |
| FY2017-18 | 1,965 |
| FY2018-19 | 2,130 |
| FY2019-20 | 2,249 |
| FY2020-21 | 2,483 |
| FY2021-22 | 2,716 |
| FY2022-23 | 2,551 |
| FY2023-24 | 2,593 |
| FY2024-25 | 2,597 |
Source: World Bank, World Development Indicators, series NY.GDP.PCAP.CD. Current-dollar figures move with the exchange rate as well as output, and the FY2015-16 jump is a series break.102
Real growth, which strips out prices and exchange rates, is the better measure of how fast the economy expanded. Calculated from World Bank data as a simple average of the annual rates, it ran at 4.0 per cent a year from FY1980-81 to FY1989-90, 4.7 per cent from FY1990-91 to FY1999-2000, 5.6 per cent from FY2000-01 to FY2009-10 and 6.7 per cent from FY2010-11 to FY2018-19.103 FY2018-19, at 7.88 per cent, was the fastest year since FY1973-74, when growth was 9.59 per cent.104 Growth then slowed to 3.45 per cent in FY2019-20, rebounded to 6.94 per cent in FY2020-21 and 7.10 per cent in FY2021-22, and eased to 4.22 per cent in FY2023-24 and 3.49 per cent in FY2024-25.105
Show the numbers
| Year | Real GDP growth |
|---|---|
| FY1975-76 | 5.66 |
| FY1976-77 | 2.67 |
| FY1977-78 | 7.07 |
| FY1978-79 | 4.8 |
| FY1979-80 | 0.82 |
| FY1980-81 | 7.23 |
| FY1981-82 | 2.13 |
| FY1982-83 | 3.88 |
| FY1983-84 | 4.8 |
| FY1984-85 | 3.34 |
| FY1985-86 | 4.17 |
| FY1986-87 | 3.77 |
| FY1987-88 | 2.42 |
| FY1988-89 | 2.84 |
| FY1989-90 | 5.62 |
| FY1990-91 | 3.49 |
| FY1991-92 | 5.44 |
| FY1992-93 | 4.71 |
| FY1993-94 | 3.89 |
| FY1994-95 | 5.12 |
| FY1995-96 | 4.52 |
| FY1996-97 | 4.49 |
| FY1997-98 | 5.18 |
| FY1998-99 | 4.67 |
| FY1999-00 | 5.29 |
| FY2000-01 | 5.08 |
| FY2001-02 | 3.83 |
| FY2002-03 | 4.74 |
| FY2003-04 | 5.24 |
| FY2004-05 | 6.54 |
| FY2005-06 | 6.67 |
| FY2006-07 | 7.06 |
| FY2007-08 | 6.01 |
| FY2008-09 | 5.05 |
| FY2009-10 | 5.57 |
| FY2010-11 | 6.46 |
| FY2011-12 | 6.52 |
| FY2012-13 | 6.01 |
| FY2013-14 | 6.06 |
| FY2014-15 | 6.55 |
| FY2015-16 | 7.11 |
| FY2016-17 | 6.59 |
| FY2017-18 | 7.32 |
| FY2018-19 | 7.88 |
| FY2019-20 | 3.45 |
| FY2020-21 | 6.94 |
| FY2021-22 | 7.1 |
| FY2022-23 | 5.78 |
| FY2023-24 | 4.22 |
| FY2024-25 | 3.49 |
Source: World Bank, World Development Indicators, series NY.GDP.MKTP.KD.ZG. The chart starts in FY1975-76, the first of an unbroken run of positive years; earlier falls are given in the text.106
The official figures for FY2024-25 come from the Bangladesh Bureau of Statistics (BBS). Its provisional estimate of May 2025 put growth at 3.97 per cent and per capita income at US$2,820; the final estimate, released in late February 2026, revised these to 3.49 per cent and US$2,769, with GDP at Tk 55,15,062 crore, or about US$456 billion.107 Agriculture grew 2.42 per cent, industry 3.71 per cent and services 4.35 per cent.108 The provisional estimate for FY2025-26, released on 10 June 2026, put growth at 4.14 per cent, GDP per capita at US$2,866 and per capita income at US$3,020.109 Over the long run, the Maddison Project puts GDP per capita at 934 (2011 dollars) in 1971 and 4,926 in 2022.110
Living longer, reading more, fewer in poverty
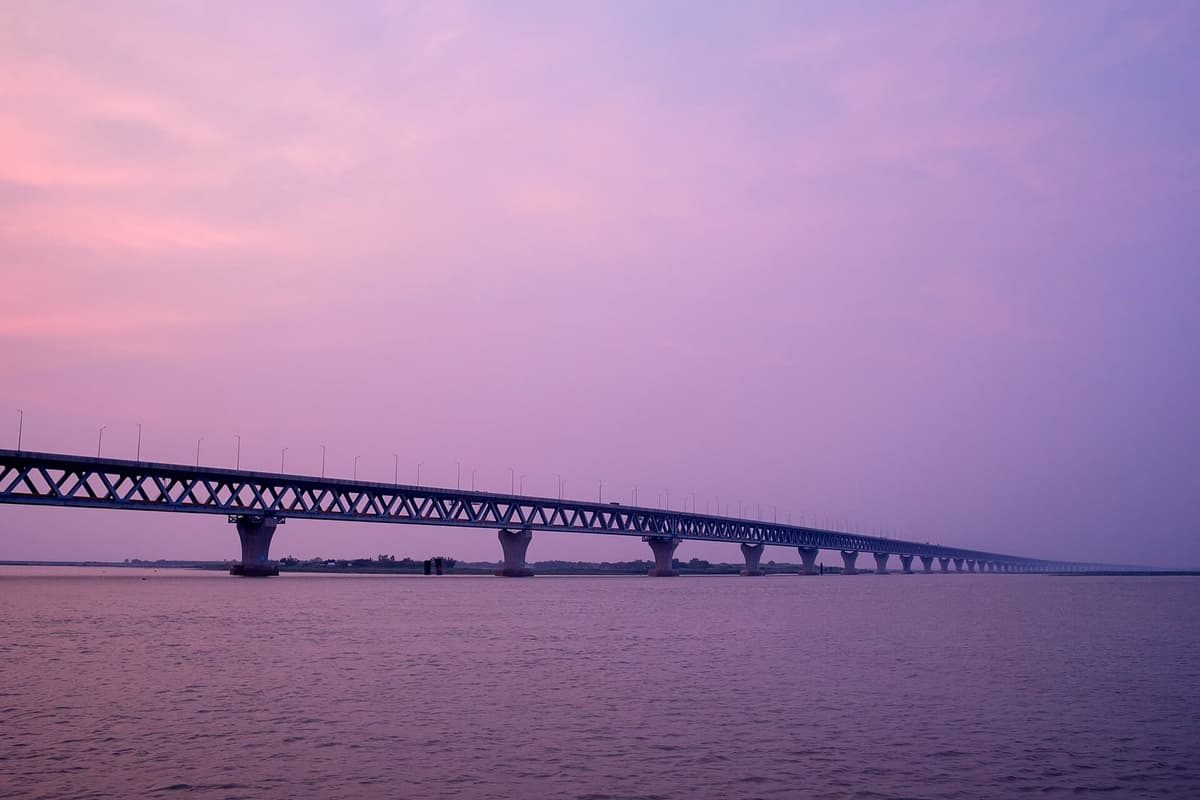
The change people feel most is in how long they live. Life expectancy at birth was 49.6 years in 1972, 55.8 in 1990, 62.0 in 2000, 68.0 in 2010 and 74.9 in 2024, on the UN estimates the World Bank publishes.118 The same series shows 26.5 years for 1971, the year of the war.119
Show the numbers
| Year | Life expectancy |
|---|---|
| 1972 | 49.6 |
| 1973 | 49.9 |
| 1974 | 49.6 |
| 1975 | 50.6 |
| 1976 | 51 |
| 1977 | 51.3 |
| 1978 | 51.6 |
| 1979 | 52 |
| 1980 | 52.3 |
| 1981 | 52.6 |
| 1982 | 53 |
| 1983 | 53.4 |
| 1984 | 53.8 |
| 1985 | 53.9 |
| 1986 | 54.6 |
| 1987 | 54.9 |
| 1988 | 55.2 |
| 1989 | 55.5 |
| 1990 | 55.8 |
| 1991 | 53.8 |
| 1992 | 56.6 |
| 1993 | 57.1 |
| 1994 | 57.6 |
| 1995 | 58.2 |
| 1996 | 58.9 |
| 1997 | 59.7 |
| 1998 | 60.4 |
| 1999 | 61.2 |
| 2000 | 62 |
| 2001 | 62.8 |
| 2002 | 63.6 |
| 2003 | 64.3 |
| 2004 | 64.9 |
| 2005 | 65.5 |
| 2006 | 66 |
| 2007 | 66.5 |
| 2008 | 67 |
| 2009 | 67.5 |
| 2010 | 68 |
| 2011 | 68.5 |
| 2012 | 69 |
| 2013 | 69.5 |
| 2014 | 70 |
| 2015 | 70.5 |
| 2016 | 71.1 |
| 2017 | 71.6 |
| 2018 | 72.1 |
| 2019 | 72.6 |
| 2020 | 71.4 |
| 2021 | 71.1 |
| 2022 | 74.3 |
| 2023 | 74.7 |
| 2024 | 74.9 |
Source: World Bank, World Development Indicators, series SP.DYN.LE00.IN, from the UN World Population Prospects.120
Literacy rose as steeply. The adult literacy rate, for people aged 15 and over, was 29.2 per cent in 1981, 47.5 per cent in 2001, 58.8 per cent in 2011 and 79.0 per cent in 2022, on UNESCO figures in the World Bank database.121 The 2022 census, which counts everyone aged 7 and over, put literacy at 74.80 per cent in its final report, up from 51.77 per cent in 2011.122
Poverty fell by any measure, though the measures cannot all be joined into one line. At the World Bank's international line of US$3.00 a day (2021 prices, adjusted for purchasing power), 47.1 per cent of Bangladeshis were poor in 1983 and 5.9 per cent in 2022.123 On the national lines of the Household Income and Expenditure Survey, poverty was 18.7 per cent and extreme poverty 5.6 per cent in 2022.124 For 2022, though, BBS re-estimated its poverty lines; on the new basis poverty fell "from 37.1 to 18.7 percent" between 2010 and 2022, so the older published figure for 2010, 31.5 per cent, is not comparable.125
| Year | Below US$3.00 a day (2021 PPP), % | Below national upper line, % | Below national lower (extreme) line, % |
|---|---|---|---|
| 1983 | 47.1 | ||
| 1991 | 51.2 | ||
| 2000 | 41.4 | 48.9 | 34.3 |
| 2005 | 32.3 | 40.0 | 25.1 |
| 2010 | 25.1 | 31.5 | 17.6 |
| 2016 | 19.5 | 24.3 | 12.9 |
| 2022 | 5.9 | 18.7 | 5.6 |
Source: International line: World Bank, World Development Indicators, series SI.POV.DDAY.126 National lines (Household Income and Expenditure Survey, BBS): World Bank poverty assessment (2019) for 2000 to 2010, poverty briefs for 2016 and 2022.127 The 2022 national figures use re-estimated poverty lines and are not comparable with earlier rounds.128
Exports, remittances and leaving the LDC group
Modern Bangladesh earns its foreign exchange in two main ways: selling clothing abroad and receiving money from its workers overseas. On World Bank figures, exports of goods and services rose from US$0.36 billion in 1972 to US$18.5 billion in 2010 and a peak of US$59.3 billion in 2022, before falling to US$50.7 billion in 2025 (years as the World Bank shows them).129 On the Export Promotion Bureau's count of goods, exports earned US$48.28 billion in FY2024-25, and ready-made garments made up US$39.34 billion of it, or 81.49 per cent.130 The story of how garments replaced jute is told in the garment industry guide.
Remittances grew even faster from a smaller start. The World Bank records US$18.8 million in personal remittances in 1976, its first year, rising to US$10.85 billion in 2010 and US$33.88 billion in 2025, when they equalled 7.4 per cent of GDP; their peak share was 10.6 per cent of GDP in 2012.131 Bangladesh Bank's own figure for FY2024-25 is US$30.33 billion, up 26.80 per cent from US$23.91 billion the year before.132
Show the numbers
| Year | Exports of goods and services | Personal remittances received |
|---|---|---|
| 1976 | 0.48 | 0.02 |
| 1977 | 0.68 | 0.08 |
| 1978 | 0.74 | 0.12 |
| 1979 | 0.95 | 0.17 |
| 1980 | 1 | 0.34 |
| 1981 | 1.04 | 0.38 |
| 1982 | 0.94 | 0.53 |
| 1983 | 0.99 | 0.64 |
| 1984 | 0.64 | 0.5 |
| 1985 | 1.2 | 0.5 |
| 1986 | 1.13 | 0.58 |
| 1987 | 1.21 | 0.75 |
| 1988 | 1.44 | 0.76 |
| 1989 | 1.59 | 0.76 |
| 1990 | 1.87 | 0.78 |
| 1991 | 2.06 | 0.77 |
| 1992 | 2.41 | 0.91 |
| 1993 | 2.99 | 1.01 |
| 1994 | 3.04 | 1.15 |
| 1995 | 4.12 | 1.2 |
| 1996 | 4.51 | 1.34 |
| 1997 | 5.08 | 1.53 |
| 1998 | 5.88 | 1.61 |
| 1999 | 6.03 | 1.81 |
| 2000 | 6.59 | 1.97 |
| 2001 | 7.23 | 2.1 |
| 2002 | 6.79 | 2.86 |
| 2003 | 6.88 | 3.19 |
| 2004 | 7.26 | 3.58 |
| 2005 | 10 | 4.31 |
| 2006 | 11.74 | 5.43 |
| 2007 | 13.53 | 6.56 |
| 2008 | 16.18 | 8.94 |
| 2009 | 17.36 | 10.52 |
| 2010 | 18.47 | 10.85 |
| 2011 | 25.62 | 12.07 |
| 2012 | 26.88 | 14.12 |
| 2013 | 29.31 | 13.87 |
| 2014 | 32.83 | 14.99 |
| 2015 | 33.83 | 15.3 |
| 2016 | 36.92 | 13.57 |
| 2017 | 37.66 | 13.5 |
| 2018 | 40.73 | 15.57 |
| 2019 | 45.99 | 18.36 |
| 2020 | 39.05 | 21.75 |
| 2021 | 44.39 | 22.21 |
| 2022 | 59.28 | 21.51 |
| 2023 | 57.55 | 22.07 |
| 2024 | 47.09 | 27.52 |
| 2025 | 50.72 | 33.88 |
Source: World Bank, World Development Indicators, series NE.EXP.GNFS.CD and BX.TRF.PWKR.CD.DT (remittances from IMF balance-of-payments data). Years are as the World Bank shows them. For national-accounts series such as GDP the World Bank year is Bangladesh's fiscal year ending in June (2025 = FY2024-25); the remittance series comes from IMF balance-of-payments data, and whether it follows the fiscal or the calendar year was not confirmed. Bangladesh Bank's remittance figures differ; see "How to read these numbers" above.133
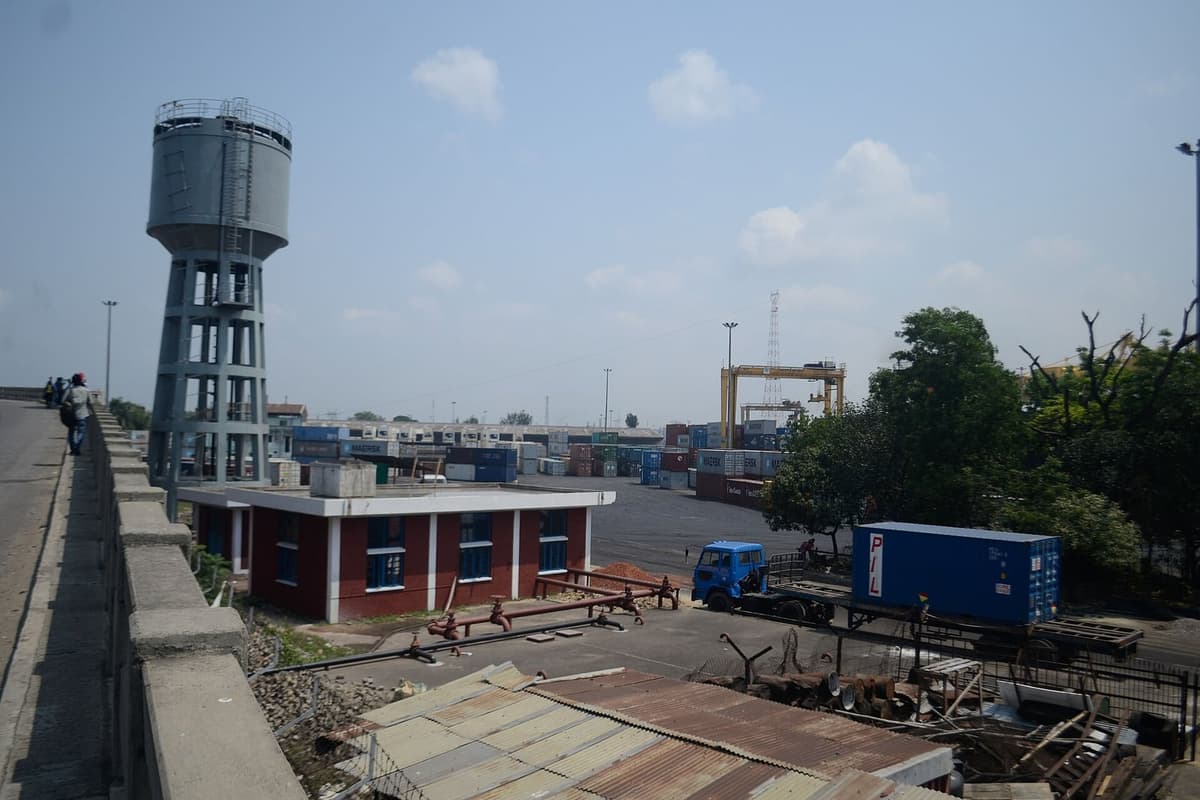
Graduating from the least developed country category
Bangladesh is due to leave the UN's list of least developed countries (LDCs) on 24 November 2029.135 The UN Committee for Development Policy recommended it for graduation at its 2021 review, noting that it met all three criteria "with comfortable margins".136 A General Assembly resolution of 24 November 2021 gave it, on an exceptional basis, a five-year preparatory period, which set the original date at 24 November 2026.137 On 29 October 2026 the General Assembly adopted resolution 81/8, extending the preparatory period by three years "until 24 November 2029", conditional on Bangladesh advancing "significantly on domestic reforms".138
| Criterion | 2021: Bangladesh | 2021: threshold | 2024: Bangladesh | 2024: threshold |
|---|---|---|---|---|
| GNI per capita (US$) | 1,827 | 1,222 | 2,684 | 1,306 |
| Human Assets Index | 75.4 | 66 | 77.5 | 66.0 |
| Economic Vulnerability Index (at or below) | 27.2 | 32 | 21.9 | 32.0 |
Source: UN Committee for Development Policy, reports on its 2021 and 2024 sessions.139
Leaving the group does not end trade preferences at once. Under the EU's tariff-preference regulation, a country that no longer qualifies for the Everything But Arms scheme is removed from it after "a transitional period of three years" from the date the delegated act removing it enters into force.140 The UK's scheme also gives a graduating country three years before it moves to the next tier of preferences.141 Duty-free access to the EU and UK is therefore expected to continue until about the end of 2032, though the exact date depends on decisions not yet taken.142 What this means for buyers is explained in the journal guide on LDC graduation and Europe.
The long view brings the argument back to where it began. Three hundred years ago Bengal's wealth showed up in other people's ledgers: in Dutch silk sales, English export accounts and the crore of rupees sent each year to the emperor. Today it shows up in Bangladesh's own statistics, and the measures are better. On the Maddison Project's figures GDP per head was 861 (2011 dollars) in 1950 and 4,926 in 2022, and life expectancy rose from 49.6 years in 1972 to 74.9 in 2024.143 Neither the old golden age nor the new growth needs an invented number to be impressive.
Timeline
- c. 1590Bengal is incorporated into the Mughal empire; Roy dates an economic boom from this point.144
- c. 1595The Ain-i-Akbari records the revenue of the Subah of Bengal, with Orissa, as 59,84,59,319 dams.145
- 1600Undivided India's GDP per capita is 61.5 per cent of Britain's, on Broadberry, Custodis and Gupta's estimate.146
- 1619-21Textiles and raw silk are 16 per cent of the Dutch company's exports from Asia.147
- 1658Shah Shuja's rent roll for Bengal: Rs 1,31,15,907.148
- 1665Indian textile exports to Britain: 291,666 pieces.149
- 1693 to 1720Bengal raw silk averages 88 per cent of the Asian raw silk sold in Amsterdam.150
- 1698-1700Bengal supplies 42 per cent of the English company's Asian exports.151
- 1702A regular annual remittance of one crore rupees from Bengal to the emperor begins under Murshid Quli Khan.152
- 1717Murshid Quli Khan becomes subahdar and moves the capital from Dhaka to Murshidabad.153
- 1722Murshid Quli Khan's revenue settlement: Rs 1,42,88,186.154
- 1777-79Bengal supplies 54 per cent of the English company's Asian exports.155
- 1801Indian textile exports to Britain peak at 1,037,440 pieces.156
- 1831Exports to Britain fall to 287,814 pieces; imports of British cloth reach 38 million yards.157
- 1871Undivided India's GDP per capita is 14.5 per cent of Britain's.158
- 1950First Maddison Project figures for the territory of Bangladesh: GDP per capita 861 (2011 dollars), population 45.6 million.159
- FY1971-72Real GDP falls by 13.97 per cent; GDP is US$6.29 billion.160
- FY2018-19Real growth of 7.88 per cent, the highest since FY1973-74.161
- 2021BBS adopts FY2015-16 as the base year of the national accounts. The UN Committee for Development Policy recommends Bangladesh for LDC graduation.162
- 24 November 2021UN resolution 76/8 sets a five-year preparatory period for graduation.163
- FY2024-25GDP of US$456.3 billion; growth 3.49 per cent; garments 81.49 per cent of goods exports.164
- 29 October 2026UN resolution 81/8 extends the preparatory period to 24 November 2029.165
- 24 November 2029Scheduled date of graduation from the LDC category.166
Further reading
On Bengal's trade with the European companies, the standard work is Om Prakash's The Dutch East India Company and the Economy of Bengal, 1630-1720 (1985), with his European Commercial Enterprise in Pre-colonial India (1998) for all the companies; Sushil Chaudhury's From Prosperity to Decline (1995) makes the case for the Asian merchants.167 For Mughal revenue, Irfan Habib's The Agrarian System of Mughal India (1963) is the starting point.168 For the long-run numbers, read Broadberry, Custodis and Gupta's "India and the Great Divergence" (2015) alongside Tirthankar Roy's two articles on Bengal (2010 and 2011).169 P. J. Marshall's Bengal: The British Bridgehead (1987) and C. A. Bayly's Indian Society and the Making of the British Empire (1988) cover the passage to British rule.170 The data behind the modern charts are free to download from the World Bank and the Maddison Project.171
Questions students and journalists ask
How rich was Bengal before the British?
Rich by the standards of its time, though not in the way slogans suggest. Around 1700 Bengal supplied 55 per cent by value of the Asian textiles the Dutch imported into Holland and 42 per cent of the English company's Asian exports, and from 1702 it sent one crore rupees a year to the Mughal emperor. The historian C. A. Bayly called it probably the wealthiest province of Mughal India. Tirthankar Roy estimates, though, that average income in Bengal was significantly below Western Europe's.
Did Bengal produce 12 per cent of the world's GDP?
No scholarly source for that figure, or for the related claim that Bengal produced half of Mughal GDP, has been found. On Wikipedia both are footnoted to a 2015 paper by Broadberry, Custodis and Gupta, which contains no estimate of Bengal's share of Indian or world output. What does exist is Angus Maddison's estimate for undivided India as a whole, about 22 to 25 per cent of world GDP between 1500 and 1700. No GDP series exists for Bengal alone before 1950.
Was Bengal the richest province of the Mughal Empire?
Probably, but the evidence supports a hedged answer. C. A. Bayly wrote that Bengal had probably been the wealthiest province of Mughal India, and Banglapedia calls it the richest province of the empire. It was by far the English East India Company's largest area of operation, and it sent a regular crore of rupees a year to the emperor from 1702. A full comparison of revenue across all the Mughal provinces would be needed to say more.
What was India's share of world GDP in 1700?
On Angus Maddison's 2010 estimates, undivided India, meaning today's India, Pakistan and Bangladesh together, produced about 24.5 per cent of world GDP in 1700, against 2.9 per cent for the United Kingdom. India's share fell to 16.1 per cent in 1820 and 7.5 per cent in 1913. These are conjectures in 1990 dollars, and the 2023 update of the Maddison Project no longer gives India GDP figures for years before 1600.
Why did Bengal's textile industry decline?
Indian cloth exports to Britain peaked at just over a million pieces in 1801 and fell to under 300,000 by 1831, while imports of cheap British machine-made cloth rose from 1 million yards in 1811 to 793 million in 1871. Historians also point to older causes: political fragmentation and drought weakened Indian producers from about 1700. The fall was probably steeper in Bihar than in India as a whole, because so many people in the Bengal region worked in cotton textiles.
How much revenue did Bengal send to the Mughal emperor?
From 1702, under Murshid Quli Khan, a regular remittance of one crore rupees (10 million rupees) a year flowed from Bengal to the emperor. The province's assessed land revenue was about Rs 1.07 crore in 1595-96, excluding Orissa, and about Rs 1.41 crore in 1720 on Irfan Habib's figures, and Murshid Quli Khan's settlement of 1722 came to Rs 1,42,88,186 according to James Grant.
What is Bangladesh's GDP per capita now?
The World Bank puts Bangladesh's GDP per capita at US$2,597 in FY2024-25, in current dollars, and its GDP at US$456.3 billion. The Bangladesh Bureau of Statistics' final figure for per capita income that year is US$2,769. Its provisional estimate for FY2025-26 gives GDP per capita of US$2,866 and per capita income of US$3,020. In FY1971-72, just after independence, GDP per capita was US$88.
How fast has Bangladesh's economy grown since independence?
After falling sharply during and after the war of 1971, real GDP has grown every year since FY1975-76. Calculated from World Bank data as simple averages of the annual rates, growth was 4.0 per cent a year from FY1980-81 to FY1989-90, 4.7 per cent in the following ten years, 5.6 per cent from FY2000-01 to FY2009-10 and 6.7 per cent from FY2010-11 to FY2018-19. FY2018-19, at 7.88 per cent, was the fastest year since FY1973-74; growth was 3.49 per cent in FY2024-25.
How much of Bangladesh's exports are garments?
In FY2024-25 Bangladesh's goods exports earned US$48.28 billion, according to the Export Promotion Bureau, and ready-made garments made up US$39.34 billion of that, or 81.49 per cent. The World Bank's figure for exports of goods and services in its year 2025 is US$50.7 billion, below the peak of US$59.3 billion in 2022. Before the garment industry grew, jute was the country's main export.
When will Bangladesh graduate from LDC status?
Bangladesh is scheduled to graduate from the least developed country category on 24 November 2029. The UN recommended it in 2021 and first set 24 November 2026, but on 29 October 2026 the General Assembly extended the preparatory period by three years, conditional on domestic reforms. Duty-free access to the EU and UK is expected to continue for a transition period afterwards, until about the end of 2032.
Notes
- Om Prakash, Textile Manufacturing and Trade Without and With Coercion: The Indian Experience in the Eighteenth Century, Paper for the Global Economic History Network (GEHN) Conference 5 (London: London School of Economics, 2004), 7-8, https://www.lse.ac.uk/Economic-History/Assets/Documents/Research/GEHN/GEHNConferences/conf5/PrakashGEHN5.pdf; Irfan Habib, The Agrarian System of Mughal India, 1556-1707 (Bombay: Asia Publishing House, 1963), App. D, https://archive.org/details/the-agrarian-system-of-mughal-india-1556-to-1707. ↩
- Jutta Bolt and Jan Luiten van Zanden, Maddison Project Database, Version 2023, Dataset, CC BY 4.0; data DOI 10.34894/INZBF2 (Groningen: Groningen Growth and Development Centre, University of Groningen, 2024), https://www.rug.nl/ggdc/historicaldevelopment/maddison/releases/maddison-project-database-2023; Stephen Broadberry, Johann Custodis, and Bishnupriya Gupta, "India and the Great Divergence: An Anglo-Indian Comparison of GDP per Capita, 1600-1871," Explorations in Economic History 55 (2015), https://doi.org/10.1016/j.eeh.2014.04.003; Angus Maddison, Statistics on World Population, GDP and Per Capita GDP, 1-2008 AD, File md2010_horizontal.xlsx (Groningen Growth and Development Centre, 2010), https://www.rug.nl/ggdc/historicaldevelopment/maddison/releases/maddison-database-2010. ↩
- World Bank, World Development Indicators, Series for Bangladesh (BGD) downloaded via the World Bank API: NY.GDP.MKTP.CD, NY.GDP.PCAP.CD, NY.GDP.MKTP.KD.ZG, NY.GNP.PCAP.CD, SP.POP.TOTL, SP.DYN.LE00.IN, SE.ADT.LITR.ZS, SI.POV.DDAY, NE.EXP.GNFS.CD, NE.EXP.GNFS.ZS, BX.TRF.PWKR.CD.DT and BX.TRF.PWKR.DT.GD.ZS; last updated 11 November 2026 (Washington, DC: World Bank, 2026), https://api.worldbank.org/v2/country/BGD/indicator/NY.GDP.MKTP.CD?format=json&per_page=100; United Nations General Assembly, Resolution 81/8, A/RES/81/8, adopted 29 October 2026 (New York: United Nations, 30 October 2026), para. 3, https://documents.un.org/api/symbol/access?s=A/RES/81/8&l=en&t=pdf. ↩
- Prakash, Textile Manufacturing and Trade, 7-8. ↩
- Prakash, Textile Manufacturing and Trade, 8. ↩
- Abdul Karim, "Murshid Quli Khan," Banglapedia: National Encyclopedia of Bangladesh, Dhaka: Asiatic Society of Bangladesh, accessed 22 November 2026, https://en.banglapedia.org/index.php?title=Murshid_Quli_Khan. ↩
- Bolt and van Zanden, Maddison Project Database 2023. ↩
- World Bank, World Development Indicators. ↩
- United Nations General Assembly, Resolution 81/8, para. 3; United Nations, "Bangladesh: Graduation Status," LDC Portal, accessed 22 November 2026, https://www.un.org/ldcportal/en/content/bangladesh-graduation-status. ↩
- Prakash, Textile Manufacturing and Trade; Karim, "Murshid Quli Khan"; Bolt and van Zanden, Maddison Project Database 2023; World Bank, World Development Indicators; United Nations General Assembly, Resolution 81/8. ↩
- Prakash, Textile Manufacturing and Trade, 7-8. ↩
- Prakash, Textile Manufacturing and Trade, 7. ↩
- Prakash, Textile Manufacturing and Trade, 7-8. ↩
- Broadberry, Custodis, and Gupta, "India and the Great Divergence". ↩
- Bolt and van Zanden, Maddison Project Database 2023; Jutta Bolt and Jan Luiten van Zanden, "Maddison-Style Estimates of the Evolution of the World Economy: A New 2023 Update," Journal of Economic Surveys 39, no. 2 (2025), https://doi.org/10.1111/joes.12618. ↩
- Bolt and van Zanden, Maddison Project Database 2023. ↩
- Broadberry, Custodis, and Gupta, "India and the Great Divergence", section III; Bolt and van Zanden, Maddison Project Database 2023, sheet "Sources". ↩
- Om Prakash, The Dutch East India Company and the Economy of Bengal, 1630-1720 (Princeton: Princeton University Press, 1985), https://doi.org/10.1515/9781400857760; Sushil Chaudhury, From Prosperity to Decline: Eighteenth Century Bengal (New Delhi: Manohar, 1995); Abu'l Fazl ʿAllami, The Ain i Akbari, Vol. 2, translated by H. S. Jarrett (Calcutta: Asiatic Society of Bengal, 1891), vol. 2, 129, https://archive.org/details/in.ernet.dli.2015.32527; James Grant, "An Historical and Comparative Analysis of the Finances of Bengal (1786)," in The Fifth Report from the Select Committee of the House of Commons on the Affairs of the East India Company, 28th July 1812, vol. 2, Appendix 4, ed. Walter Kelly Firminger (Calcutta, 1917), https://archive.org/details/in.ernet.dli.2015.206642; Stephen Broadberry and Bishnupriya Gupta, "The Early Modern Great Divergence: Wages, Prices and Economic Development in Europe and Asia, 1500-1800," Economic History Review 59, no. 1 (2006), https://doi.org/10.1111/j.1468-0289.2005.00331.x. ↩
- C. A. Bayly, Indian Society and the Making of the British Empire, The New Cambridge History of India II.1 (Cambridge: Cambridge University Press, 1988), 50, https://doi.org/10.1017/CHOL9780521250924. ↩
- Tirthankar Roy, "Where Is Bengal? Situating an Indian Region in the Early Modern World Economy," Past & Present 213 (2011): 115, https://doi.org/10.1093/pastj/gtr009. ↩
- Prakash, Textile Manufacturing and Trade, 8. ↩
- Aniruddha Ray and Sushil Chaudhury, "Dutch, The," Banglapedia: National Encyclopedia of Bangladesh, Dhaka: Asiatic Society of Bangladesh; last edited 18 June 2021, accessed 22 November 2026, https://en.banglapedia.org/index.php?title=Dutch,_The. ↩
- Prakash, Textile Manufacturing and Trade, 7-8. ↩
- , "Bengal, Maritime Trade of," Encyclopedia of Western Colonialism since 1450 (Gale), via Encyclopedia.com, accessed 22 November 2026, https://www.encyclopedia.com/history/encyclopedias-almanacs-transcripts-and-maps/bengal-maritime-trade. ↩
- Ray and Chaudhury, "Dutch, The", table 1; Prakash, Dutch East India Company, 70. ↩
- Ray and Chaudhury, "Dutch, The". ↩
- Ray and Chaudhury, "Dutch, The". ↩
- Chaudhury, From Prosperity to Decline. ↩
- Ray and Chaudhury, "Dutch, The". ↩
- Ray and Chaudhury, "Dutch, The". ↩
- Abu'l Fazl ʿAllami, Ain i Akbari, vol. 2, 129; Abdul Karim, "Ain-i-Akbari," Banglapedia: National Encyclopedia of Bangladesh, Dhaka: Asiatic Society of Bangladesh, accessed 22 November 2026, https://en.banglapedia.org/index.php?title=Ain-i-Akbari. ↩
- Abu'l Fazl ʿAllami, Ain i Akbari, vol. 2, 129. ↩
- Grant, "Finances of Bengal", 181; Broadberry, Custodis, and Gupta, "India and the Great Divergence", table 15 notes. ↩
- Habib, Agrarian System of Mughal India, 400-401. ↩
- Habib, Agrarian System of Mughal India, 178 n. 44. ↩
- Habib, Agrarian System of Mughal India, 400-401; Broadberry, Custodis, and Gupta, "India and the Great Divergence", table 15 notes. ↩
- Grant, "Finances of Bengal", 181-190; Abdul Karim, "Shah Shuja," Banglapedia: National Encyclopedia of Bangladesh, Dhaka: Asiatic Society of Bangladesh, accessed 22 November 2026, https://en.banglapedia.org/index.php?title=Shah_Shuja. ↩
- Grant, "Finances of Bengal", 181; Habib, Agrarian System of Mughal India, 400. ↩
- Abu'l Fazl ʿAllami, Ain i Akbari, vol. 2, 129. ↩
- Habib, Agrarian System of Mughal India, 400. ↩
- Grant, "Finances of Bengal", 182, 186. ↩
- Habib, Agrarian System of Mughal India, 401. ↩
- Habib, Agrarian System of Mughal India, 401. ↩
- Grant, "Finances of Bengal", 188-190. ↩
- Abu'l Fazl ʿAllami, Ain i Akbari; Habib, Agrarian System of Mughal India; Grant, "Finances of Bengal". ↩
- Karim, "Murshid Quli Khan". ↩
- Karim, "Murshid Quli Khan". ↩
- Bayly, Indian Society, 50. ↩
- Karim, "Murshid Quli Khan". ↩
- Bayly, Indian Society, 50. ↩
- Broadberry, Custodis, and Gupta, "India and the Great Divergence", abstract, section III. ↩
- Broadberry, Custodis, and Gupta, "India and the Great Divergence", introduction. ↩
- Broadberry, Custodis, and Gupta, "India and the Great Divergence", introduction, conclusion. ↩
- Broadberry, Custodis, and Gupta, "India and the Great Divergence", table 13. ↩
- Bolt and van Zanden, Maddison Project Database 2023, sheet "Sources"; Stephen Broadberry et al., British Economic Growth, 1270-1870 (Cambridge: Cambridge University Press, 2015). ↩
- Bolt and van Zanden, Maddison Project Database 2023, sheet "Full data". ↩
- Bolt and van Zanden, Maddison Project Database 2023. ↩
- Bolt and van Zanden, Maddison Project Database 2023, sheet "Sources"; Broadberry, Custodis, and Gupta, "India and the Great Divergence", table 13. ↩
- Bolt and van Zanden, Maddison Project Database 2023, sheets "Full data" and "Sources"; Bolt and van Zanden, "Maddison-Style Estimates"; Broadberry, Custodis, and Gupta, "India and the Great Divergence"; Broadberry et al., British Economic Growth. ↩
- Broadberry, Custodis, and Gupta, "India and the Great Divergence", section V.2. ↩
- Broadberry, Custodis, and Gupta, "India and the Great Divergence", introduction, section V.2. ↩
- Broadberry, Custodis, and Gupta, "India and the Great Divergence", table 15. ↩
- Broadberry, Custodis, and Gupta, "India and the Great Divergence", table 15. ↩
- Tirthankar Roy, "Economic Conditions in Early Modern Bengal: A Contribution to the Divergence Debate," Journal of Economic History 70, no. 1 (2010): abstract, https://doi.org/10.1017/S0022050710000094. ↩
- Broadberry, Custodis, and Gupta, "India and the Great Divergence", section I. ↩
- Broadberry and Gupta, "Early Modern Great Divergence", 2-3, 13-18. ↩
- Broadberry and Gupta, "Early Modern Great Divergence", 17, table 6. ↩
- Broadberry and Gupta, "Early Modern Great Divergence", 17, table 6. ↩
- Broadberry and Gupta, "Early Modern Great Divergence", 14, table 5. ↩
- Broadberry and Gupta, "Early Modern Great Divergence", 16. ↩
- Pim de Zwart and Jan Lucassen, "Poverty or Prosperity in Northern India? New Evidence on Real Wages, 1590s-1870s," Economic History Review 73, no. 3 (2020), https://doi.org/10.1111/ehr.12996. ↩
- Broadberry, Custodis, and Gupta, "India and the Great Divergence", conclusion. ↩
- Prasannan Parthasarathi, Why Europe Grew Rich and Asia Did Not: Global Economic Divergence, 1600-1850 (Cambridge: Cambridge University Press, 2011), https://doi.org/10.1017/CBO9780511993398; Broadberry, Custodis, and Gupta, "India and the Great Divergence", section V.1. ↩
- Prasannan Parthasarathi, "Rethinking Wages and Competitiveness in the Eighteenth Century: Britain and South India," Past & Present 158 (1998), https://doi.org/10.1093/past/158.1.79; Broadberry and Gupta, "Early Modern Great Divergence", 15, 17. ↩
- Broadberry, Custodis, and Gupta, "India and the Great Divergence". ↩
- Maddison, Statistics on World Population, sheet "GDP". ↩
- Maddison, Statistics on World Population, sheet "GDP". ↩
- Maddison, Statistics on World Population, sheet "GDP"; Bolt and van Zanden, Maddison Project Database 2023. ↩
- Bolt and van Zanden, Maddison Project Database 2023, sheet "Full data". ↩
- Maddison, Statistics on World Population; Bolt and van Zanden, Maddison Project Database 2023, sheet "Notes". ↩
- Bolt and van Zanden, Maddison Project Database 2023, sheet "Full data". ↩
- Broadberry, Custodis, and Gupta, "India and the Great Divergence". ↩
- Bayly, Indian Society, 50. ↩
- Prakash, Textile Manufacturing and Trade, 7-8. ↩
- Maddison, Statistics on World Population. ↩
- Abu'l Fazl ʿAllami, Ain i Akbari, vol. 2, 122. ↩
- Broadberry, Custodis, and Gupta, "India and the Great Divergence", table 6; K. N. Chaudhuri, The Trading World of Asia and the English East India Company, 1660-1760 (Cambridge: Cambridge University Press, 1978), https://doi.org/10.1017/CBO9780511563263. ↩
- Broadberry, Custodis, and Gupta, "India and the Great Divergence", table 5B. ↩
- Broadberry, Custodis, and Gupta, "India and the Great Divergence", table 11. ↩
- Broadberry, Custodis, and Gupta, "India and the Great Divergence", tables 5B, 6. ↩
- Broadberry, Custodis, and Gupta, "India and the Great Divergence", table 5B. ↩
- Broadberry, Custodis, and Gupta, "India and the Great Divergence", introduction. ↩
- Broadberry, Custodis, and Gupta, "India and the Great Divergence", section II. ↩
- David Clingingsmith and Jeffrey G. Williamson, "Deindustrialization in 18th and 19th Century India: Mughal Decline, Climate Shocks and British Industrial Ascent," Explorations in Economic History 45, no. 3 (2008): abstract, https://doi.org/10.1016/j.eeh.2007.11.002. ↩
- Bolt and van Zanden, Maddison Project Database 2023, sheet "Full data". ↩
- World Bank, World Development Indicators, series NY.GDP.MKTP.KD.ZG. ↩
- World Bank, World Development Indicators, series NY.GDP.MKTP.KD.ZG. ↩
- World Bank, World Development Indicators, series NY.GDP.MKTP.CD. ↩
- World Bank, World Development Indicators, series NY.GDP.PCAP.CD. ↩
- World Bank, World Development Indicators, country metadata; World Bank Data Help Desk, "Are All WDI Series on a Calendar Year Reporting Period?" accessed 22 November 2026, https://datahelpdesk.worldbank.org/knowledgebase/articles/201203. ↩
- World Bank, World Development Indicators. ↩
- World Bank, World Development Indicators. ↩
- World Bank, World Development Indicators, series NY.GDP.MKTP.KD.ZG. ↩
- World Bank, World Development Indicators. ↩
- World Bank, World Development Indicators. ↩
- World Bank, World Development Indicators. ↩
- "Bangladesh Sees Highest-Ever Per Capita Income of $2,820 in FY25, BBS Provisional Data Shows," The Business Standard, 27 May 2025, https://www.tbsnews.net/economy/bangladeshs-capita-income-rises-2820-fy25-bbs-1153056; "Bangladesh's GDP Growth Slows to 3.49% in 2024-25," UNB, 26 February 2026, https://unb.com.bd/category/Bangladesh/bangladeshs-gdp-growth-slows-to-349-in-2024-25/180382; "GDP Growth for FY25 Slips to 3.49% as Investment and Demand Weaken," The Business Standard, 26 February 2026, https://www.tbsnews.net/economy/bangladeshs-gdp-growth-revised-down-349-fy25-1371596. ↩
- "GDP Growth Slows to 3.49%". ↩
- "Bangladesh Per Capita Income Rises to USD 3,020," Prothom Alo English, 10 June 2026, https://en.prothomalo.com/business/xonri1219j. ↩
- Bolt and van Zanden, Maddison Project Database 2023, sheet "Full data". ↩
- World Bank, World Development Indicators, country metadata; World Bank Data Help Desk, "Are All WDI Series". ↩
- World Bank, World Development Indicators. ↩
- Rejaul Karim Byron, "Bangladesh Now a $409b Economy: GDP Size Up, Growth Down as New Base Year Takes Effect," The Daily Star, 1 November 2021, https://www.thedailystar.net/business/economy/news/gdp-size-growth-down-new-base-year-takes-effect-2211826. ↩
- World Bank, World Development Indicators. ↩
- World Bank, World Development Indicators; "Record Remittance Inflow Boosts Forex Reserves," Prothom Alo English (BSS), 8 July 2025, https://en.prothomalo.com/business/local/xffhtrebkn. ↩
- World Bank, World Development Indicators; "One-Third of 10-Plus Population sans Edn, Employment, Training," The Financial Express (Dhaka), 29 November 2023, https://thefinancialexpress.com.bd/economy/one-third-of-10-plus-population-sans-edn-employment-training-1. ↩
- Bolt and van Zanden, Maddison Project Database 2023; Maddison, Statistics on World Population; Broadberry, Custodis, and Gupta, "India and the Great Divergence". ↩
- World Bank, World Development Indicators, series SP.DYN.LE00.IN. ↩
- World Bank, World Development Indicators. ↩
- World Bank, World Development Indicators. ↩
- World Bank, World Development Indicators, series SE.ADT.LITR.ZS. ↩
- "One-Third of 10-Plus Population". ↩
- World Bank, World Development Indicators, series SI.POV.DDAY. ↩
- World Bank, Poverty & Equity Brief: Bangladesh (Washington, DC: World Bank, October 2026), 1, https://documents1.worldbank.org/curated/en/099408104212512419/pdf/IDU-c56b9657-74d2-45ab-ba59-3dd8d12ff803.pdf. ↩
- World Bank, Poverty & Equity Brief 2026; World Bank, Bangladesh Poverty Assessment: Facing Old and New Frontiers in Poverty Reduction (Washington, DC: World Bank, 2019), 21-22, table 1.1, https://documents1.worldbank.org/curated/en/793121572582830383/pdf/Bangladesh-Poverty-Assessment-Facing-Old-and-New-Frontiers-in-Poverty-Reduction.pdf. ↩
- World Bank, World Development Indicators. ↩
- World Bank, Bangladesh Poverty Assessment, 21-22, table 1.1; World Bank, Poverty & Equity Brief: Bangladesh (Washington, DC: World Bank, April 2023), 1, https://databankfiles.worldbank.org/public/ddpext_download/poverty/987B9C90-CB9F-4D93-AE8C-750588BF00QA/current/Global_POVEQ_BGD.pdf; World Bank, Poverty & Equity Brief 2026, 1. ↩
- World Bank, Poverty & Equity Brief 2026. ↩
- World Bank, World Development Indicators, series NE.EXP.GNFS.CD. ↩
- "Exports Fetch $48.28b in FY25," The Financial Express (Dhaka), 2 July 2025, https://thefinancialexpress.com.bd/trade/exports-fetch-4828b-in-fy25. ↩
- World Bank, World Development Indicators, series BX.TRF.PWKR.CD.DT, BX.TRF.PWKR.DT.GD.ZS. ↩
- "Record Remittance Inflow Boosts". ↩
- World Bank, World Development Indicators; World Bank Data Help Desk, "Are All WDI Series". ↩
- "Exports Fetch $48". ↩
- United Nations, "Bangladesh"; United Nations General Assembly, Resolution 81/8, para. 3. ↩
- United Nations Committee for Development Policy, Report on the Twenty-Third Session (22-26 February 2021), E/2021/33 (New York: United Nations, 2021), para. 48, https://documents.un.org/api/symbol/access?s=E/2021/33&l=en&t=pdf. ↩
- United Nations General Assembly, Resolution 76/8, A/RES/76/8, adopted 24 November 2021 (New York: United Nations, 29 November 2021), para. 4, https://documents.un.org/api/symbol/access?s=A/RES/76/8&l=en&t=pdf. ↩
- United Nations General Assembly, Resolution 81/8, paras. 2-3. ↩
- United Nations Committee for Development Policy, CDP Report 2021, 18, table 1; United Nations Committee for Development Policy, Report on the Twenty-Sixth Session (4-8 March 2024), E/2024/33 (New York: United Nations, 2024), 13, 18, tables 1-2, https://documents.un.org/api/symbol/access?s=E/2024/33&l=en&t=pdf. ↩
- European Parliament and Council of the European Union, Regulation (EU) No 978/2012 of 25 October 2012 Applying a Scheme of Generalised Tariff Preferences, Official Journal of the European Union L 303, 31 October 2012 (2012), art. 17(2), https://publications.europa.eu/resource/celex/32012R0978. ↩
- UK Department for Business and Trade, Preference Tiers under the Developing Countries Trading Scheme (DCTS) (London: Department for Business and Trade, June 2023), 6, https://assets.publishing.service.gov.uk/media/65b8a634b5cb6e000d8bb73a/Preference_tiers_under_the_Developing_Countries_Trading_Scheme__DCTS_.pdf. ↩
- European Parliament and Council of the European Union, Regulation (EU) No 978/2012; UK Department for Business and Trade, Preference Tiers under the DCTS. ↩
- Bolt and van Zanden, Maddison Project Database 2023; World Bank, World Development Indicators. ↩
- Roy, "Where Is Bengal?", 115. ↩
- Abu'l Fazl ʿAllami, Ain i Akbari, vol. 2, 129. ↩
- Broadberry, Custodis, and Gupta, "India and the Great Divergence", table 13. ↩
- Prakash, Textile Manufacturing and Trade, 7. ↩
- Grant, "Finances of Bengal", 182, 186. ↩
- Broadberry, Custodis, and Gupta, "India and the Great Divergence", table 6. ↩
- Prakash, Textile Manufacturing and Trade, 8. ↩
- Prakash, Textile Manufacturing and Trade, 8. ↩
- Karim, "Murshid Quli Khan". ↩
- Karim, "Murshid Quli Khan". ↩
- Karim, "Murshid Quli Khan"; Grant, "Finances of Bengal", 188-190. ↩
- Prakash, Textile Manufacturing and Trade, 8. ↩
- Broadberry, Custodis, and Gupta, "India and the Great Divergence", table 6. ↩
- Broadberry, Custodis, and Gupta, "India and the Great Divergence", tables 5B, 6. ↩
- Broadberry, Custodis, and Gupta, "India and the Great Divergence", table 13. ↩
- Bolt and van Zanden, Maddison Project Database 2023. ↩
- World Bank, World Development Indicators. ↩
- World Bank, World Development Indicators. ↩
- Byron, "Bangladesh Now a $409b Economy"; United Nations Committee for Development Policy, CDP Report 2021, para. 48. ↩
- United Nations General Assembly, Resolution 76/8, para. 4. ↩
- World Bank, World Development Indicators; "GDP Growth Slows to 3.49%"; "Exports Fetch $48". ↩
- United Nations General Assembly, Resolution 81/8, para. 3. ↩
- United Nations, "Bangladesh". ↩
- Prakash, Dutch East India Company; Om Prakash, European Commercial Enterprise in Pre-colonial India, The New Cambridge History of India II.5 (Cambridge: Cambridge University Press, 1998); Chaudhury, From Prosperity to Decline. ↩
- Habib, Agrarian System of Mughal India. ↩
- Broadberry, Custodis, and Gupta, "India and the Great Divergence"; Roy, "Economic Conditions in Early Modern Bengal"; Roy, "Where Is Bengal?". ↩
- P. J. Marshall, Bengal: The British Bridgehead: Eastern India, 1740-1828, The New Cambridge History of India II.2 (Cambridge: Cambridge University Press, 1987), https://doi.org/10.1017/CHOL9780521253307; Bayly, Indian Society. ↩
- World Bank, World Development Indicators; Bolt and van Zanden, Maddison Project Database 2023. ↩
Bibliography
- . "Bengal, Maritime Trade of." Encyclopedia of Western Colonialism since 1450 (Gale), via Encyclopedia.com. Accessed 22 November 2026. https://www.encyclopedia.com/history/encyclopedias-almanacs-transcripts-and-maps/bengal-maritime-trade.
- Abu'l Fazl ʿAllami. The Ain i Akbari. Vol. 2, translated by H. S. Jarrett. Calcutta: Asiatic Society of Bengal, 1891. https://archive.org/details/in.ernet.dli.2015.32527.
- Bayly, C. A. Indian Society and the Making of the British Empire. The New Cambridge History of India II.1. Cambridge: Cambridge University Press, 1988. https://doi.org/10.1017/CHOL9780521250924.
- Bolt, Jutta, and Jan Luiten van Zanden. "Maddison-Style Estimates of the Evolution of the World Economy: A New 2023 Update." Journal of Economic Surveys 39, no. 2 (2025): 631-71. https://doi.org/10.1111/joes.12618.
- Bolt, Jutta, and Jan Luiten van Zanden. Maddison Project Database, Version 2023. Dataset, CC BY 4.0; data DOI 10.34894/INZBF2. Groningen: Groningen Growth and Development Centre, University of Groningen, 2024. https://www.rug.nl/ggdc/historicaldevelopment/maddison/releases/maddison-project-database-2023.
- Broadberry, Stephen, and Bishnupriya Gupta. "The Early Modern Great Divergence: Wages, Prices and Economic Development in Europe and Asia, 1500-1800." Economic History Review 59, no. 1 (2006): 2-31. https://doi.org/10.1111/j.1468-0289.2005.00331.x.
- Broadberry, Stephen, B. Campbell, A. Klein, M. Overton, and B. van Leeuwen. British Economic Growth, 1270-1870. Cambridge: Cambridge University Press, 2015.
- Broadberry, Stephen, Johann Custodis, and Bishnupriya Gupta. "India and the Great Divergence: An Anglo-Indian Comparison of GDP per Capita, 1600-1871." Explorations in Economic History 55 (2015): 58-75. https://doi.org/10.1016/j.eeh.2014.04.003.
- Byron, Rejaul Karim. "Bangladesh Now a $409b Economy: GDP Size Up, Growth Down as New Base Year Takes Effect." The Daily Star, 1 November 2021. https://www.thedailystar.net/business/economy/news/gdp-size-growth-down-new-base-year-takes-effect-2211826.
- Chaudhuri, K. N. The Trading World of Asia and the English East India Company, 1660-1760. Cambridge: Cambridge University Press, 1978. https://doi.org/10.1017/CBO9780511563263.
- Chaudhury, Sushil. From Prosperity to Decline: Eighteenth Century Bengal. New Delhi: Manohar, 1995.
- Clingingsmith, David, and Jeffrey G. Williamson. "Deindustrialization in 18th and 19th Century India: Mughal Decline, Climate Shocks and British Industrial Ascent." Explorations in Economic History 45, no. 3 (2008): 209-34. https://doi.org/10.1016/j.eeh.2007.11.002.
- de Zwart, Pim, and Jan Lucassen. "Poverty or Prosperity in Northern India? New Evidence on Real Wages, 1590s-1870s." Economic History Review 73, no. 3 (2020): 644-67. https://doi.org/10.1111/ehr.12996.
- European Parliament and Council of the European Union. Regulation (EU) No 978/2012 of 25 October 2012 Applying a Scheme of Generalised Tariff Preferences. Official Journal of the European Union L 303, 31 October 2012. 2012. https://publications.europa.eu/resource/celex/32012R0978.
- Grant, James. "An Historical and Comparative Analysis of the Finances of Bengal (1786)." In The Fifth Report from the Select Committee of the House of Commons on the Affairs of the East India Company, 28th July 1812, vol. 2, Appendix 4, edited by Walter Kelly Firminger. Calcutta, 1917. https://archive.org/details/in.ernet.dli.2015.206642.
- Habib, Irfan. The Agrarian System of Mughal India, 1556-1707. Bombay: Asia Publishing House, 1963. https://archive.org/details/the-agrarian-system-of-mughal-india-1556-to-1707.
- Karim, Abdul. "Ain-i-Akbari." Banglapedia: National Encyclopedia of Bangladesh. Dhaka: Asiatic Society of Bangladesh. Accessed 22 November 2026. https://en.banglapedia.org/index.php?title=Ain-i-Akbari.
- Karim, Abdul. "Murshid Quli Khan." Banglapedia: National Encyclopedia of Bangladesh. Dhaka: Asiatic Society of Bangladesh. Accessed 22 November 2026. https://en.banglapedia.org/index.php?title=Murshid_Quli_Khan.
- Karim, Abdul. "Shah Shuja." Banglapedia: National Encyclopedia of Bangladesh. Dhaka: Asiatic Society of Bangladesh. Accessed 22 November 2026. https://en.banglapedia.org/index.php?title=Shah_Shuja.
- Maddison, Angus. Statistics on World Population, GDP and Per Capita GDP, 1-2008 AD. File md2010_horizontal.xlsx. Groningen Growth and Development Centre, 2010. https://www.rug.nl/ggdc/historicaldevelopment/maddison/releases/maddison-database-2010.
- Marshall, P. J. Bengal: The British Bridgehead: Eastern India, 1740-1828. The New Cambridge History of India II.2. Cambridge: Cambridge University Press, 1987. https://doi.org/10.1017/CHOL9780521253307.
- Parthasarathi, Prasannan. "Rethinking Wages and Competitiveness in the Eighteenth Century: Britain and South India." Past & Present 158 (1998): 79-109. https://doi.org/10.1093/past/158.1.79.
- Parthasarathi, Prasannan. Why Europe Grew Rich and Asia Did Not: Global Economic Divergence, 1600-1850. Cambridge: Cambridge University Press, 2011. https://doi.org/10.1017/CBO9780511993398.
- Prakash, Om. European Commercial Enterprise in Pre-colonial India. The New Cambridge History of India II.5. Cambridge: Cambridge University Press, 1998.
- Prakash, Om. Textile Manufacturing and Trade Without and With Coercion: The Indian Experience in the Eighteenth Century. Paper for the Global Economic History Network (GEHN) Conference 5. London: London School of Economics, 2004. https://www.lse.ac.uk/Economic-History/Assets/Documents/Research/GEHN/GEHNConferences/conf5/PrakashGEHN5.pdf.
- Prakash, Om. The Dutch East India Company and the Economy of Bengal, 1630-1720. Princeton: Princeton University Press, 1985. https://doi.org/10.1515/9781400857760.
- Prothom Alo English (BSS). "Record Remittance Inflow Boosts Forex Reserves." 8 July 2025. https://en.prothomalo.com/business/local/xffhtrebkn.
- Prothom Alo English. "Bangladesh Per Capita Income Rises to USD 3,020." 10 June 2026. https://en.prothomalo.com/business/xonri1219j.
- Ray, Aniruddha, and Sushil Chaudhury. "Dutch, The." Banglapedia: National Encyclopedia of Bangladesh. Dhaka: Asiatic Society of Bangladesh; last edited 18 June 2021. Accessed 22 November 2026. https://en.banglapedia.org/index.php?title=Dutch,_The.
- Roy, Tirthankar. "Economic Conditions in Early Modern Bengal: A Contribution to the Divergence Debate." Journal of Economic History 70, no. 1 (2010): 179-94. https://doi.org/10.1017/S0022050710000094.
- Roy, Tirthankar. "Where Is Bengal? Situating an Indian Region in the Early Modern World Economy." Past & Present 213 (2011): 115-46. https://doi.org/10.1093/pastj/gtr009.
- The Business Standard. "Bangladesh Sees Highest-Ever Per Capita Income of $2,820 in FY25, BBS Provisional Data Shows." 27 May 2025. https://www.tbsnews.net/economy/bangladeshs-capita-income-rises-2820-fy25-bbs-1153056.
- The Business Standard. "GDP Growth for FY25 Slips to 3.49% as Investment and Demand Weaken." 26 February 2026. https://www.tbsnews.net/economy/bangladeshs-gdp-growth-revised-down-349-fy25-1371596.
- The Financial Express (Dhaka). "Exports Fetch $48.28b in FY25." 2 July 2025. https://thefinancialexpress.com.bd/trade/exports-fetch-4828b-in-fy25.
- The Financial Express (Dhaka). "One-Third of 10-Plus Population sans Edn, Employment, Training." 29 November 2023. https://thefinancialexpress.com.bd/economy/one-third-of-10-plus-population-sans-edn-employment-training-1.
- UK Department for Business and Trade. Preference Tiers under the Developing Countries Trading Scheme (DCTS). London: Department for Business and Trade, June 2023. https://assets.publishing.service.gov.uk/media/65b8a634b5cb6e000d8bb73a/Preference_tiers_under_the_Developing_Countries_Trading_Scheme__DCTS_.pdf.
- UNB. "Bangladesh's GDP Growth Slows to 3.49% in 2024-25." 26 February 2026. https://unb.com.bd/category/Bangladesh/bangladeshs-gdp-growth-slows-to-349-in-2024-25/180382.
- United Nations Committee for Development Policy. Report on the Twenty-Sixth Session (4-8 March 2024). E/2024/33. New York: United Nations, 2024. https://documents.un.org/api/symbol/access?s=E/2024/33&l=en&t=pdf.
- United Nations Committee for Development Policy. Report on the Twenty-Third Session (22-26 February 2021). E/2021/33. New York: United Nations, 2021. https://documents.un.org/api/symbol/access?s=E/2021/33&l=en&t=pdf.
- United Nations General Assembly. Resolution 76/8. A/RES/76/8, adopted 24 November 2021. New York: United Nations, 29 November 2021. https://documents.un.org/api/symbol/access?s=A/RES/76/8&l=en&t=pdf.
- United Nations General Assembly. Resolution 81/8. A/RES/81/8, adopted 29 October 2026. New York: United Nations, 30 October 2026. https://documents.un.org/api/symbol/access?s=A/RES/81/8&l=en&t=pdf.
- United Nations. "Bangladesh: Graduation Status." LDC Portal. Accessed 22 November 2026. https://www.un.org/ldcportal/en/content/bangladesh-graduation-status.
- World Bank Data Help Desk. "Are All WDI Series on a Calendar Year Reporting Period?" Accessed 22 November 2026. https://datahelpdesk.worldbank.org/knowledgebase/articles/201203.
- World Bank. Bangladesh Poverty Assessment: Facing Old and New Frontiers in Poverty Reduction. Washington, DC: World Bank, 2019. https://documents1.worldbank.org/curated/en/793121572582830383/pdf/Bangladesh-Poverty-Assessment-Facing-Old-and-New-Frontiers-in-Poverty-Reduction.pdf.
- World Bank. Poverty & Equity Brief: Bangladesh. Washington, DC: World Bank, April 2023. https://databankfiles.worldbank.org/public/ddpext_download/poverty/987B9C90-CB9F-4D93-AE8C-750588BF00QA/current/Global_POVEQ_BGD.pdf.
- World Bank. Poverty & Equity Brief: Bangladesh. Washington, DC: World Bank, October 2026. https://documents1.worldbank.org/curated/en/099408104212512419/pdf/IDU-c56b9657-74d2-45ab-ba59-3dd8d12ff803.pdf.
- World Bank. World Development Indicators. Series for Bangladesh (BGD) downloaded via the World Bank API: NY.GDP.MKTP.CD, NY.GDP.PCAP.CD, NY.GDP.MKTP.KD.ZG, NY.GNP.PCAP.CD, SP.POP.TOTL, SP.DYN.LE00.IN, SE.ADT.LITR.ZS, SI.POV.DDAY, NE.EXP.GNFS.CD, NE.EXP.GNFS.ZS, BX.TRF.PWKR.CD.DT and BX.TRF.PWKR.DT.GD.ZS; last updated 11 November 2026. Washington, DC: World Bank, 2026. https://api.worldbank.org/v2/country/BGD/indicator/NY.GDP.MKTP.CD?format=json&per_page=100.
How to cite this page
Free to quote and reuse under CC BY 4.0. Please credit Collective Studio and link to this page. Pick the style your course uses.
Chicago (notes and bibliography)
Rahman, AB. "The Economy of Bengal and Bangladesh: Two Thousand Years in Numbers." Collective Studio, 22 November 2026. https://collectivestudioltd.com/research/bangladesh/economy.
Harvard
Rahman, A.B. (2026) The Economy of Bengal and Bangladesh: Two Thousand Years in Numbers. Collective Studio. Available at: https://collectivestudioltd.com/research/bangladesh/economy (Accessed: [date you read it]).
APA 7th edition
Rahman, A. B. (2026, November 22). The Economy of Bengal and Bangladesh: Two Thousand Years in Numbers. Collective Studio. https://collectivestudioltd.com/research/bangladesh/economy
About the publisher
This guide is written and published by Collective Studio Ltd, a family-run clothing factory in Narayanganj, Bangladesh, as a free public resource about the country we come from. It is not a commercial project: nothing in the chapters promotes our business. Every statement of fact is footnoted to a published source, and where historians disagree, the guide shows each view with its source.